What’s up Guys! Welcome to automationcalling.com

Introduction
In this article, we will have a detail understanding and idea of how to build a telemetry dashboard for Sonar Metrics using Grafana.
Pre-requisites
The following are pre-requisites that need to be installed and setup in your local machine. You may use Docker image which is quite handy and easy setup.
- Prometheus (Latest Release)
- Grafana (Latest release)
- Sonar
Installation
- Download and Install the Prometheus Exporter in the link
- Stop Sonar Server in your local
- Drop
sonar-prometheus-exporter-1.0.0 SNAPSHOT.jarinto$SONARQUBE_HOME/extensions/plugins - Start Sonar Server
- Once Server is up, verify Metrics endpoint: http://<SERVER>:9000/api/prometheus/metrics
Note: The above endpoints returns Prometheus Exporter format which can be configured and scrapped in your Prometheus DB Configuration
Screenshots
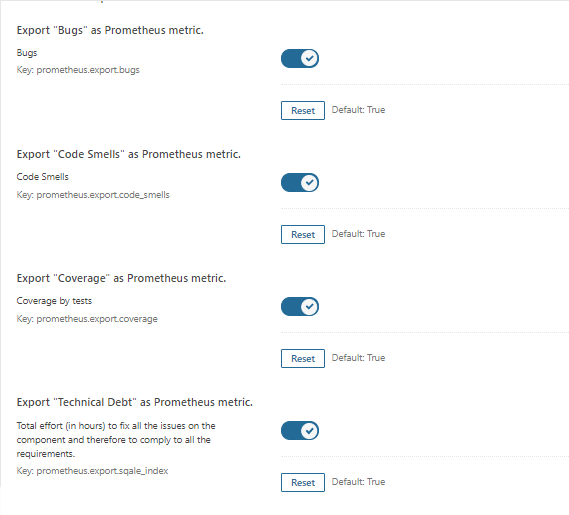
- Open Sonar ->Administration->Prometheus Exporter displayed
- Click on Prometheus Exporter
- You will see exporter option configuration as below snapshot.
Usage
- Stop Prometheus Docker service
- Open “prometheus.yml” file where you installed docker
- Update the following commands (Replace Localhost with different host if your server is running in remote)
scrape_configs:
  - job_name: 'sonarqube'
    metrics_path: '/api/prometheus/metrics'
    static_configs:
- targets: ['localhost:9000']- Save and start the docker container
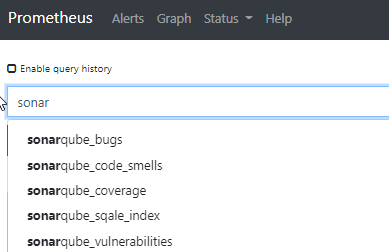
- Open Prometheus server for eg., http://localhost:9090
- enter the text “sonar” in search box which returns Prometheus Gauge Metrics as below
Building Grafana Dashboard
So far we have seen how to set up Open Source Prometheus Exporter, Configuration and verified Gauge Metrics, which are set. Now, it’s time for Visualization.
What is Grafana?
According to Grafana.com, Grafana is a multi-platform open source analytics and interactive visualization web application. It provides charts, graphs, and alerts for the web when connected to supported data sources, It is expandable through a plug-in system.
Data Sources Configuration
Grafana offers multiple Data Source like Prometheus, InfluxDB, PostgresSQL, CloudWatch and more. In this article, we will see Prometheus Configuration.
- Go to Data Sources in Grafana
- Select Prometheus Datasource and configure where your Prometheus DB is running
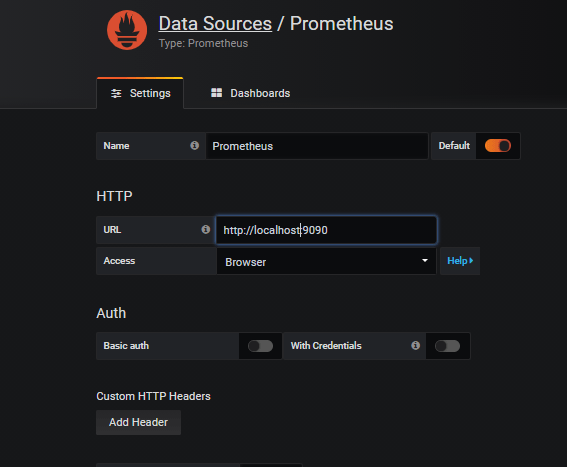
- Test and Verify connection is established successfully
Creating a Dashboard
Grafana offers to import open source Dashboard Design or allow you to create a new template. In this article, we will use custom dashboard design by our own and get Sonar Metrics for eg., Code Coverage.
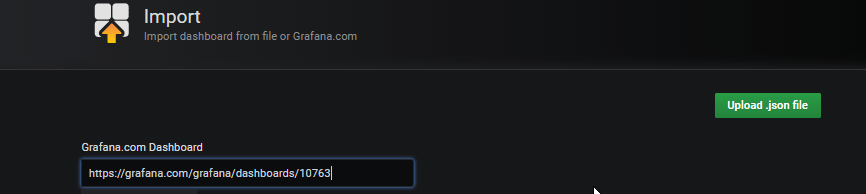
In case, if you want to use existing template available in the market, Go to Dashboard and Select Import and add its id like below.
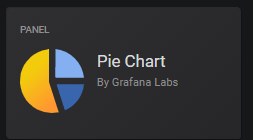
For our Example, I create empty Dashboard and Add Panel with Pie chart
Once I added, Configure the PromQL (Prometheus Query)
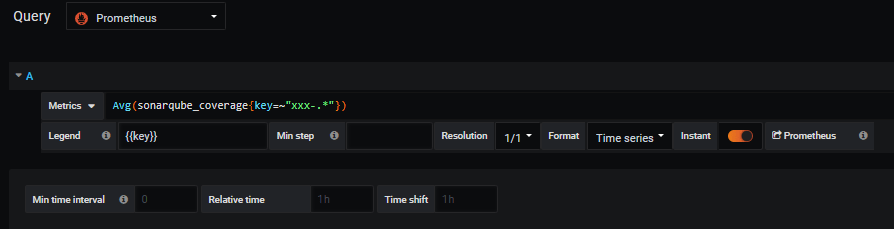
In the above snapshot, I’m adding aggregating function to get Average Metrics for Overall Projects Start with “XXX-.” which means, it read all code coverage of project name start with XXX and calculate Average Code Coverage overall project in percentage.
The result of Runtime Dashboard looks like below

The above one is sample, similar like you can built your own custom dashboard and its Metrics to collect real time data easily
Hope! this post may be helpful to you guys.
Thanks for your time, please do subscribe for more updates!

Leave a comment